How to Build a Balanced Scorecard From Scratch Using Excel
Having a tool that can measure our performance without having a goal in mind can create a degree of uncertainty in our campaign’s progress. Americans Robert Kaplan and David Norton created the first balanced scorecard in 1992 to avoid this situation.
So, what is a balanced scorecard? It’s a business management tool that measures a company’s activities from a long-term view and strategy. This philosophy grants business a global vision of an organization’s growth and vision through the balanced scorecard’s indicators.
Therefore, a balanced scorecard is a fundamental tool for managing your business strategy. It can measure every function inside a digital enterprise and the progression of performance figures through control indicators.
You’ll need to learn how to build a balanced scorecard using Excel to transmit all these numbers. A balanced scorecard dashboard Excel template helps us visualize the performance and KPIs for every department in an organization from marketing, sales, Human Resources, IT, and more.
Seven points you should know when creating a balanced scorecard in Excel
Before you go about building your balanced scorecard, you need to gather all the pieces of information you need on a strategic level that will serve as the foundation for building the balanced scorecard with Excel. We’ve created seven guiding points for starting our balanced scorecard in Excel:
1. Board
The Board (or Dashboard) gives us a big picture view of our strategic vision through four perspectives:
-
Customer Perspective: This perspective identifies and evaluates customers’ needs and opinions like satisfaction, return rate, or profitability. The goal is to offer a selection of products or services that align with their preferences.
-
Financial Perspective: This perspective gets controlled from the highest levels of your org chart since it involves business figures (earnings, risk, sales growth, gross/net margin, and answers the needs of your investors.
-
Internal Business Perspective: This perspective pinpoints your organization’s strategic goals and metrics and production. It decides your value proposition and competitive advantages to align critical functions and processes to generate quality.
-
Innovation and Learning Perspective: It refers to an organization’s ability to grow and adapt by developing its human capital.
2. Strategic Goals
When it comes to determining how to build a balanced scorecard in Excel, you have to make defining the strategic goals from each of the four perspectives a priority.
The most characteristic goals we analyzed in our balanced scorecard in Excel are the following and broken down by perspectives:
-
Customer Perspective: Some sample metrics include the total number of customers (active customers and new customer acquisition) that you measure through indicators like market share and the percentage of earnings coming from new customers; customer satisfaction through surveys, the rates of complaints or suggestions, response times, and more. It also includes customer loyalty metrics, including purchase frequency or the average time it takes to retain users and reduce measurable delivery times that you can measure through the time you spend on them.
-
Financial Perspective: Value creation through indicators, the sustainability of that value in the future, growth rates at an individual level along with those of the industry on a global level, business rate, profitability measured through indicators, costs, financial structure, and lastly, liquidity.
-
Internal Business Perspective: Reduction in production costs, individual production costs, business process improvements, and how many, process performance, the total number of defects, and full-cycle times, among others.
-
Innovation and Learning Perspective: Talent, skills, know-how, and abilities that you measure through personnel selection and training metrics. It can also include information capital such as value creation, strategy-building, and time and cost metrics. Finally, they have organizational capital metrics, such as leadership, culture, and teamwork.
3. Actions and Observations
In this section, we make a checklist of all the actions to achieve every goal. We’ll have to assign all the resources involved in these actions and summarize the tasks in every effort to complete our balanced scorecard in Excel.
We must consider the factors that directly impact the success of every action. You may have to put in money or whatever you need to complete a previous action.
4. Metrics
This sheet will be our base for all the data we derive from our suite of analytics tools (Analytics, ERPs, CRMs). It will show the quantitative growth of our organization by comparing the indicated goals with the real results. This section will have different KPIs and graphics that will let us know if we’re digressing or not from the path to meeting them.
5. Target
Regardless of the type of balanced scorecard, you must set the target audience for every action you plan. You then have to appropriately gear those actions while taking characteristics like age, gender, location, preferences and tastes, needs and problems, and more into consideration.
6. Schedule
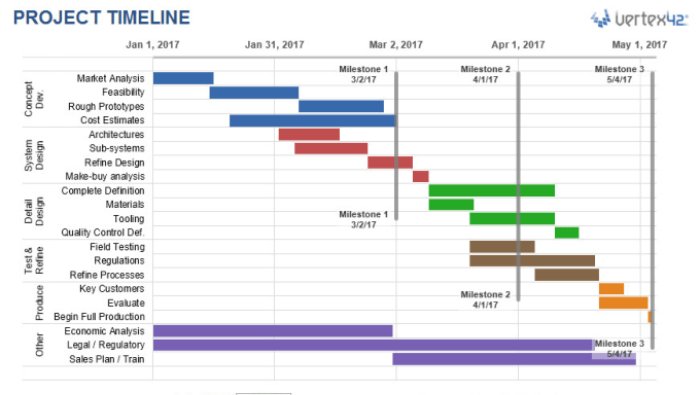
Source: Fiverr
Our balanced scorecard’s schedule represents our actions in time. This feature helps us timely detect the dependent activities or milestones to hit to achieve our overall objectives.
The schedule not only manages the production times for the activities but also the resources that are involved in executing them.
7. Responsibility
Every action must have a designated person to be in charge of driving and achieving the stipulated goals. They tend to be those in charge of every department specializing with a high degree of involvement and a results-oriented mindset.
In closing, these seven points will guide you as you wonder how to build a balanced scorecard in Excel. The goal is to have your business activities under control while noting any deviations in your goals and strategies to correct them on time.
Subscribe to our newsletter and stay up to date with the latest digital trends.
Subscribe to our newsletter and stay up to date with the latest digital trends.
No thanks. My inbox is fine as it is.