Practical guide to content metrics
A brief disclaimer:
Before reading, I want you to know that I’m not an expert analyst, but a SEO strategist and digital marketing consultant. On the other hand, in my daily work as an auditor and holistic digital marketing strategist, I work a lot with Analytics to understand the deficiencies and opportunities of my clients. Because of this, what you’re about to read isn’t a “definitive guide”, but instead my personal and practical guide of content and its metrics, full of links to useful resources that helped me solve the mystery of metrics with larger content. I would love to see your ideas in the comments.

Fuente: Moz.com
One of the hardest things to measure is the effectiveness of content, mostly because there’s a lot of confusion about its changing nature and purpose. A common problem is to think of “content” and “formats” as synonyms, which is what drives the frustration and, with the erroneous escalation of actual processes, can also lead to disasters in Google.
What is the difference between content and format?
-
Content is any message that a brand/person delivers to an audience
-
Formats are the specific ways in which a brand/person can deliver this message (for example, data visualization, written content, images/photos, videos, etc).
So it’s clear: we engage with and sometimes share the ideas and emotions that the content represents, not its formats. Formats are only the clothes we choose for our content and, maintaining the fashion metaphor, some ways of dressing are better than others when it comes to creating a more explicit message.
Strategy, like everything in the marketing world, plays a very important role when it comes to content. It’s during the strategic phase when we try to understand (thanks to both the analysis of our own side and the analysis of the sites of competitors) if our content responds to the interests and needs of our audience and what parameters we have to choose when it comes to evaluating its success or failure.
To paraphrase an old Pirelli commercial slogan: “Content without strategy is nothing”.
Strategy content: from why/how/what
When we are building a content strategy, we have to ask ourselves (and our clients and CMOs) the classic questions:
-
Why does the brand exist?
-
How does the brand show the “why”?
-
What specific tactics does the brand use to successfully develop the “how”?
Only when we have these answers can we understand the goals of our content, what parameters we have to consider, and how to calculate them.
We are going to use the example of Moz’s strategy, one of the most recognized SEO suites worldwide.
Practical example of content strategy: Moz
Why does Moz exist?
The answer is in its slogan:
“There’s a smarter way to do SEO”
How does Moz consolidate its “why”?
-
Moz produces a series of tools that helps marketers in auditing, following, and making interesting decisions about their web projects
-
On the other hand, Moz creates and publishes content with the objective of educating marketing professionals on how to better do their jobs.
If you think about it, we can already distinguish a few generic goals:
-
Leads > subscriptions
-
Brand consciousness (which can ultimately lead to leads)
What specific tactics does Moz use to successfully meet its main goals?
Taking into account the nature of the two main objectives, we can find the content tactics that cover all the areas of the so-called “content matrix”.
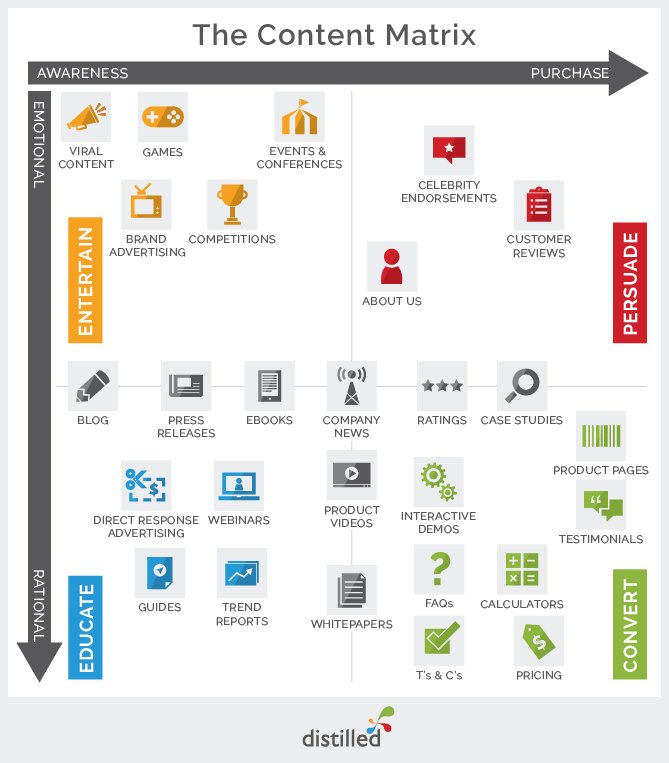
(Fuente: Brainlabs)
Some of the classic content matrixes are those developed by Distilled (now part of Brainlabs) and Smart Insights, but it’s a good idea to develop your own matrix based on the ideas that can exist in your specific industry niche.
Moz has many functions, among which are:
What MOZ does in terms of “Transaction”, conversion, and persuasion as final objectives:
-
Homepage and ‘Products’ section of Moz.com that directs its two main products (Moz Pro and Moz Local) to the landing pages.
-
Specific landing pages for specific products, which also offer the option of testing at the “cost” of a free subscription to the webpage.
-
CPC landing pages
-
Subscription fee pages for tools
-
Testimonial page
-
Solution page for different types of needs (big companies, SMEs, and agencies)
-
“About” section
On the awareness side to educate and encourage engagement with the user:
-
Content blog
-
“Resources” section, that includes the Q&A
-
“Academia” section, that also offers the possibility of obtaining certificates that confirm knowledge of determined areas of web positioning
-
“Learning SEO” section
-
SEO guide for beginners
-
Biweekly newsletter
-
Mozcon, the conference between the most recognized companies in the Search Marketing industry, that is held every year in Seattle (virtually in 2020 and 2021)
Once we have the content inventory of our website, we can easily identify the specific objectives for the different content pieces and the type of content that we will create.
Also, content inventory should be carried out at a competitive level to then perform a gap analysis and to see what content our competitors are producing and we aren’t, and judge if and how it would be opportune to integrate it into our content strategy.
In addition to this type of analysis, it’s convenient to audit our content in light of something essential as well: its promotion
A very useful model is what we see below, developed by Rand Fishkin:
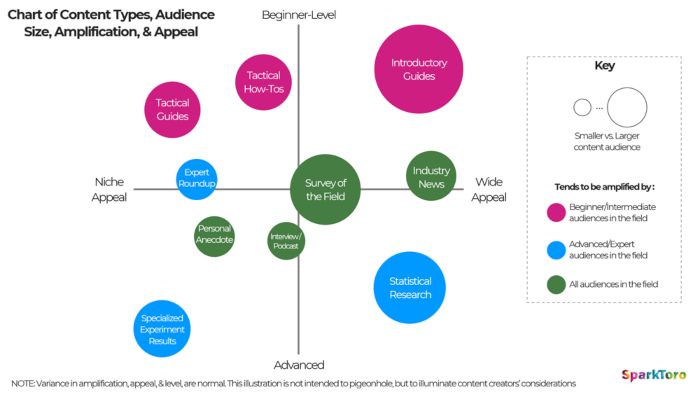
Fuente: Sparktoro
This latest concept is super important because it’s very common to base our content strategy only on the base of our Buyer personas, and completely forget to also consider our Audience, which is those that have the capacity to influence the decision making (and tastes) of our buyer personas.
Content metrics and how to measure landing pages
This could be the simplest aspect of measuring contents, given that it is profoundly related to the more general measures of leads and conversions, and is also strongly related to everything that is defined as CRO (Conversion Rate Optimization).
We can measure the effectiveness of our landing pages easily with Google Analytics, especially if we keep in mind the implementation of content groups; they work very well for the implementation of both with Google Analytics and Google Tag Manager. I advise reading this guide from Builtvisible.
On the other hand, we must always remember that the default conversion rate metric should not be used as the only metric to incorporate into decision making.
The same happens when it’s about content performance and its optimization. In fact, the better we follow our analysis, the better we will understand the functioning of our landing pages, giving a better understanding of the value of the conversion rate and, therefore, correcting and improving our sales and potential clients.
Good examples of segmenting are:
-
Conversions by recurring visitors vs. new visitors
-
Conversions by type of visit based on demographic data
-
Conversions by channel/device
These segmented metrics are fundamental for the development of A/B tests with our content.
These are some examples of A/B tests of landing page content:
-
Different title tags and metadescriptions (yes, the title tags and metadescriptions are content too and play a fundamental role in CTR and “first impressions”)
-
A highlighted presence of testimonials instead of a discrete presence
-
The tone of voice used in the product description (play with the writing)
-
Product image gallery vs. video presentation of the product
Here are some additional sources about CRO and content that can inspire you better than I can, without a doubt, in this specific field:
On-site measurement of editorial content

Here is where it starts to get a bit complicated.
Blog posts, guides, whitepapers, and similar content usually don’t serve as natural lead conversions, at least not directly.
Usually, their objectives are more intangible, like creating familiarity and brand recognition, trust, and authority...in practice, to be useful in the E-A-T- environment (expertise, authoritativeness, and trustworthiness).
In other cases, this type of content also serves the goal of creating and maintaining an active community, as in the case of Moz. I tend to consider this a subset given that in many niches, creating a community isn’t a priority. Or, even if it is, it doesn’t offer a trusty flow of “signals” when it comes to correctly measuring the effectiveness of our content due to the pure lack of statistical evidence.
A good starting point is measuring the so-called “consumption indicators”.
Again, the idea is to implement content grouping in Google Analytics, because this way, we can segment each different type of editorial content.
For example, if we have a blog, we can’t just create a group for it, but we could create:
-
As many groups as there are categories and tags in our blog
-
Groups according to the average length of the posts
-
Groups by the type of formats used (posts with videos, posts with infographics, long-form type posts, etc)
These are just three examples. Reflect on your own needs and the nature of your content and you will come up with new ideas to categorize your content.
These are the basic metrics that we have to keep in mind when measuring our editorial content:
-
Page views/unique page views
-
Pages/Session
-
Time on page
Ideally, you would analyze these metrics with at least these secondary levels:
-
Medium/Resources: to be able to understand what channel contributes most to the visibility of the content
-
Type of user: to check what percentage of the page visits is due to returning visitors (a good indicator of the level of trust and authority that your content has) and the new ones (which indicates the capacity of our content to attract new readers that will potentially come back to visit our site).
-
Mobile: useful in the comprehension of the environments in which our users interact with our content and how we have to optimize their experience in function of the device used and therefore help to make our content more memorable (be careful, even if it is true that the use of the cell phone is the majority, in a still high number of industries, the navigation on a desktop PC remains the primary one).
Surely, we can have fun analyzing the content performance through reader segmentation by demographic indicators as well.
For example, it can be interesting to see which categories that are related to our readers exist, depending on the categorization used in our blog and what we have replicated in the grouping by content groups in Analytics. This, in fact, can help us better understand the people that make up our audience and then perfect the focus of our content.
As you can see, I haven’t mentioned the bounce rate as a metric to consider and there’s a reason: quantifying the bounce rate is complicated and its erroneous interpretation can lead to bad decisions.
Instead of a bounce rate, when we’re talking about editorial content (and blog entries in particular), I prefer to consider what scrolls are performed on my page, a metric that we can record using Tag Manager (see this Google entry - and this Merkle guide).
In addition, an important metric is Dwell Time, which tells you the navigation time of a user from the time they entered from Google Search until, for one reason or another, they go back to the search results.
If the Dwell time is low, this is a bad sign, because it tells us that the visitor didn’t find the answer they were looking for on our page.
This metric, in addition to being important for judging the objective quality of our content, is also one of the few user signs, which Google has recognized as a ranking factor.
We can measure Dwell time with Tag Manager, here’s how.
Finally, we can also measure how the enriched content present on our page is consumed (video, image gallery, audios). Again, it is possible to do it thanks to Google Tag Manager.
For example, if our content has videos, we can measure the views of it following the simple steps, which are laid out in this guide. However, if we really want to dive deep into the analysis of how our content is consumed by our users, we would have to export the data from Google Analytics and then combine it with data from external sources, like YouTube Analytics in the case of videos.

Consumption metrics alone, however, are not enough to understand the performance of our content, especially if they are based primarily on a community and one of our content goals was to create and expand a community around our brand.
I’m talking about the so-called ‘sharing metrics’:
-
Social shares (Likes, Tweets, Pins, etc.)
-
Inbound links
-
Mentions without links
-
Email forwarding
All this can be traced and measured. I usually add comments to these metrics, due to the social nature that comments have.
Once again, thanks to Tag Manager, we can easily tag when someone clicks the “Add Comment” button or other buttons (see this post).
A definitive metric that we have to keep in mind is the page value. Here’s how Google explains it on its help page:
‘Page value is a measure of influence. It is a single number that can help you better understand which pages on your site help convert and generate revenue. Pages with a high value are more influential than pages with a low page value [Page value is also shown for content groups]'.
The combined analysis of the consumption and social indicators can offer us a very detailed understanding of how our content is behaving.
Therefore, we will know how to optimize our strategy and/or how to initiate A/B tests.
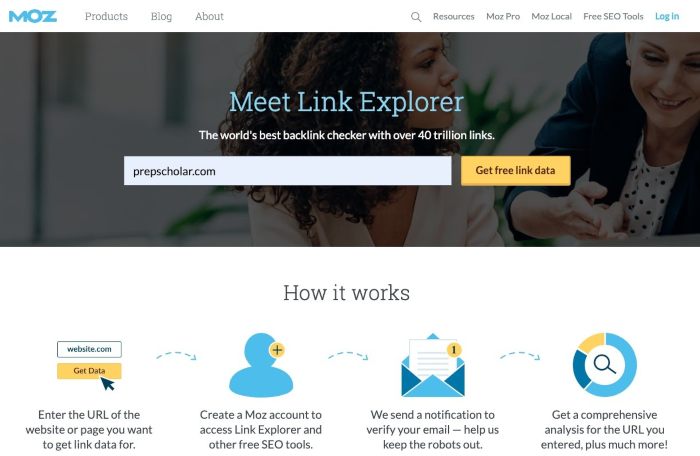
Fuente: Moz.com
How to measure the ROI of content marketing and link building campaigns based on content
Theoretically measuring the return on investment is something relatively easy: (Return - Investment) / Investment = RIO
However, the difficulty isn’t in the formula itself, but in the values used.
How do I calculate the value of the investment?
Generally, we have a determined budget assigned to our content marketing and/or content based campaigns. If this is the case, perfect! We have a figure that will be used for the investment value.
A completely different situation is when we have to present a budget proposal and/or assign a part of the budget for each campaign in a balanced and considerate way.
This is what I do:
1. Identify the distinct competitors that create content related to what we are going to use with our campaign. I rely on the analysis of search engine results that a tool like SemRush can offer us and the information that we can gather with a “keyword search” in Buzzsumo.
2. Gather all the significant metrics related to content:
-
Links (again with Semrush, they are also available through other SEO tools like Ahrefs)
-
Social shares on each social network (available on Buzzsumo)
-
Traffic estimation of a content URL (data obtained through SimilarWeb or, again, Semrush).
3. Assign a monetary value to the gathered metrics.
4. Calculate the potential value of the competition’s investment.
5. Calculate the average investment value of all competition
6. Consider the difference between what the client/company previously invested in content marketing content (or link building or digital PR), as well as the value of the average investment of competitors
7. Calculate and propose the value of the content marketing/content-based campaign in a range that goes from the “minimum viable budget” to the “ideal”.
Reality teaches us that the proposed investment isn’t the same as real investment, but at least we will have some data to submit and not just a hunch. However, we have to be prepared to work with proposals that are closer to the “minimum viable” and not the “ideal”.
How to calculate income?
You can find a good number of ROI calculators, but I particularly like Fractl, as it is easy to use and understand.
The general philosophy is to calculate the ROI in terms of traffic quantity, links, and social actions that the content has organically generated; therefore, how much the paid promotion contributed. Remember the previously mentioned methodology (points 1 -7).
However, when we’re talking about social shares, we must avoid the classic error of considering only those directly generated on the page in which our content has been published.
For example, take Verve Search's worldwide campaigns for HotelClub.com, which won the European Search Awards.
If we just look at their own social metrics, we will have a partial image:
However, if we see the social shares of the pages that are linked and those that talk about their content, we will have a much fuller chart.

We can use (again) BuzzSumo to gather this data (also using its content analysis characteristic) or use URL Profiler (https://urlprofiler.com/). As you can imagine, we can calculate the ROI of our editorial content with the same methodology.
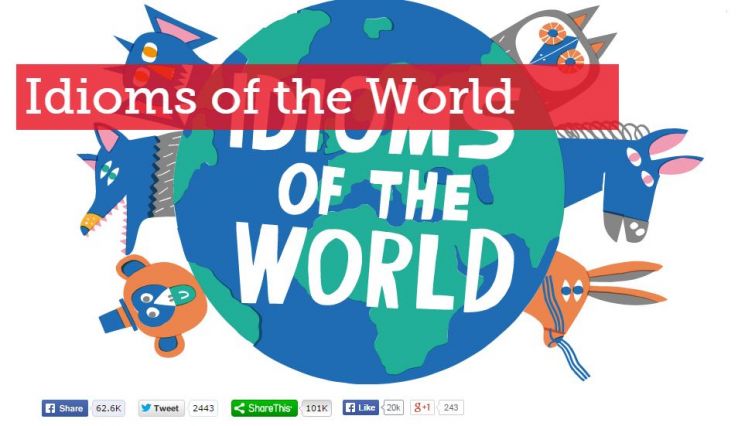
Obviously the Fractl ROI calculation is far from perfect, given that it doesn’t take into account the offline repercussions that a content campaign can have. The campaign “The Idioms of the World” was organically published in an exceptional location in the paper version of The Guardian, for example, or Rise at Seven's 'The Game Christmas Tinner' campaign for the UK retail chain Game was quoted by Stephen Colbert on The Colbert Show in the US and featured on The One Show and Good Morning Britain.
However, it’s a solid base on which to elaborate your own ROI calculation.
Conclusions
We’ve arrived at the end of this personal guide about the content and its metrics. Remember these important things:
-
Don’t get carried away by the data, educate yourself with it
-
Think strategically, act tactically
-
Content metrics vary in function of the content itself
Subscribe to our newsletter and stay up to date with the latest digital trends.
Subscribe to our newsletter and stay up to date with the latest digital trends.
No thanks. My inbox is fine as it is.